Array Simulations
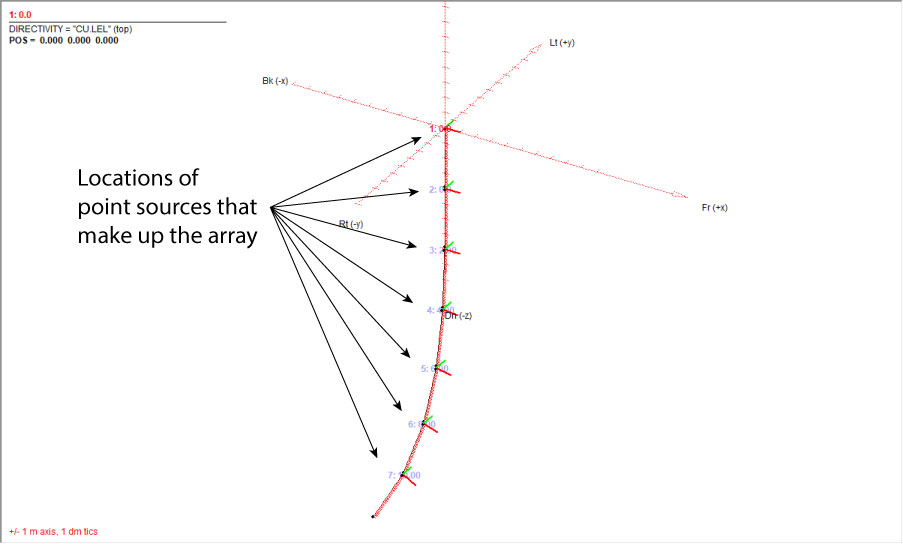
One of the greatest challenges to computer simulation is the loudspeaker array. It’s one thing to place some point sources into a virtual environment and calculate their complex interaction. It’s quite another to achieve results that correlate with the performance of a real-world array. PST has performed multiple array studies through the years where we strap multiple boxes together and compare measured to modeled performance. This provides a lot of insight on the accuracy of the process and what matters (and what doesn’t).
Realistic Expectations
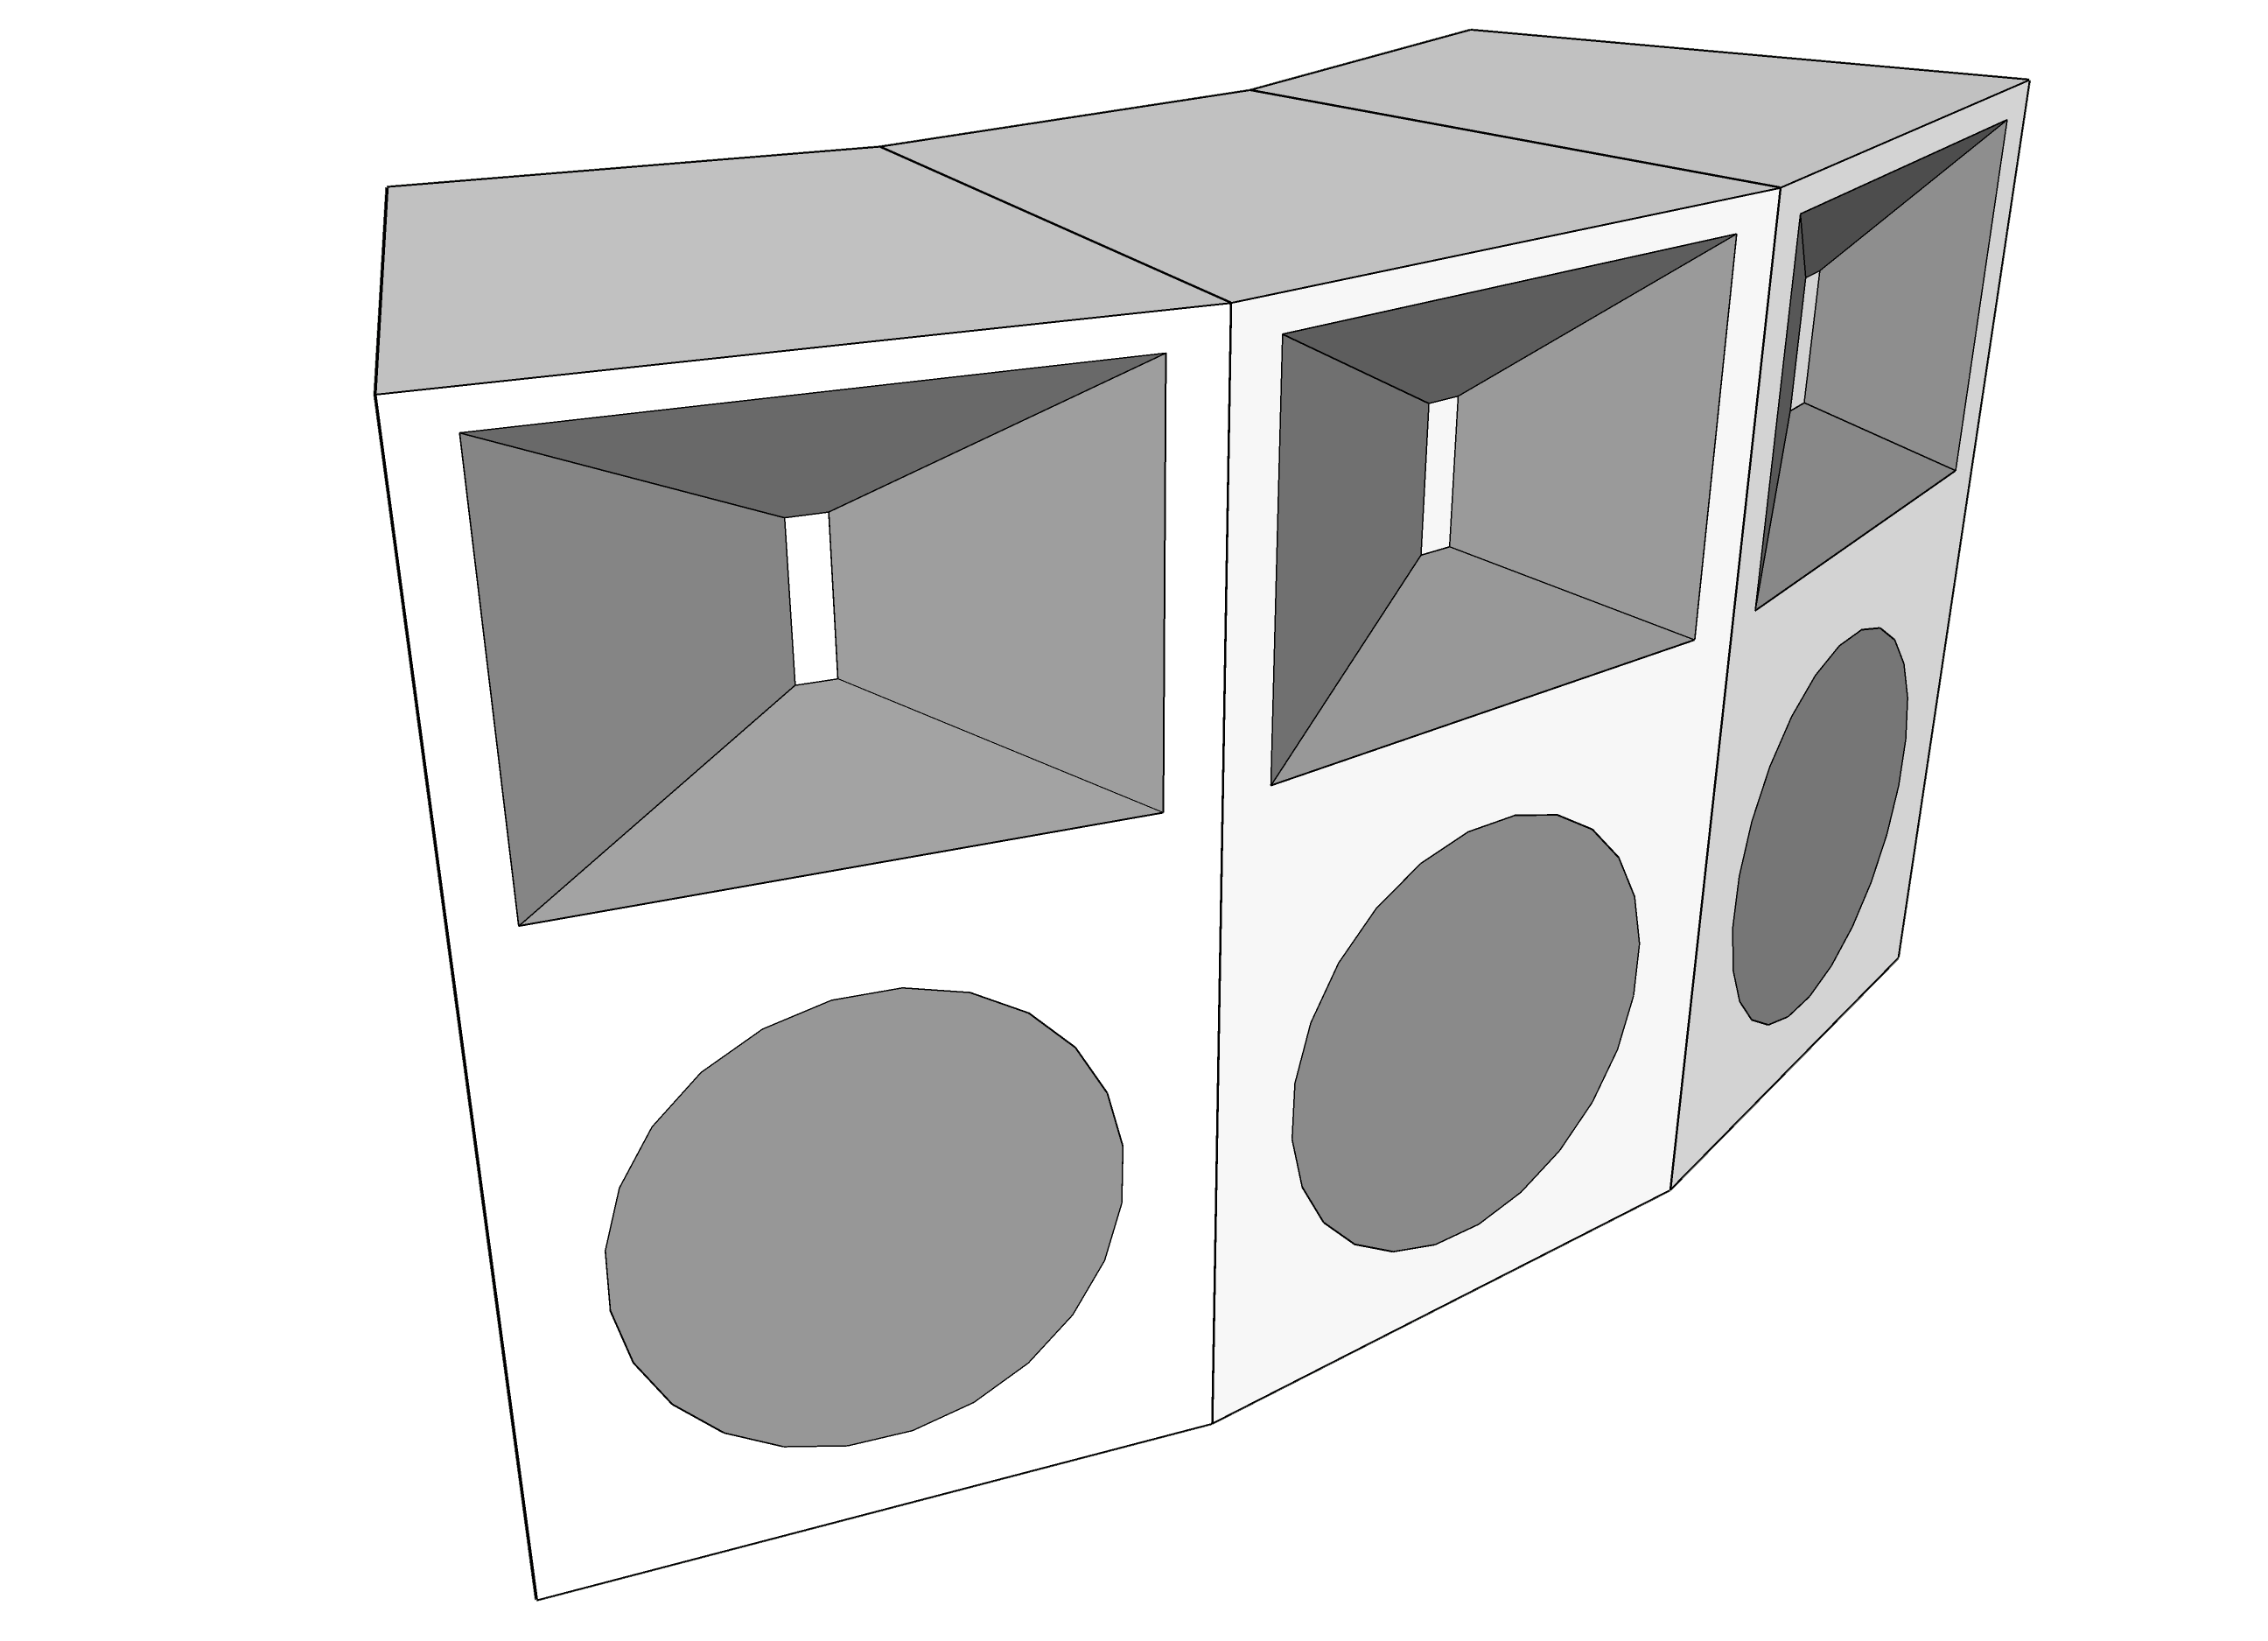
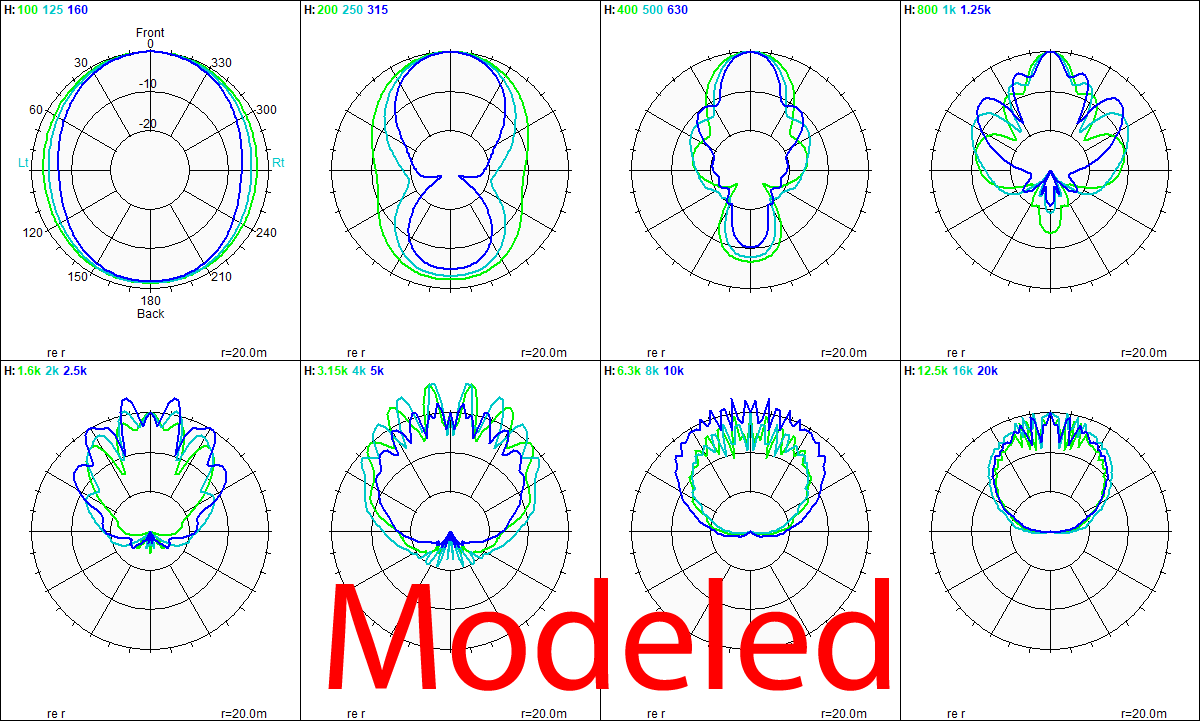
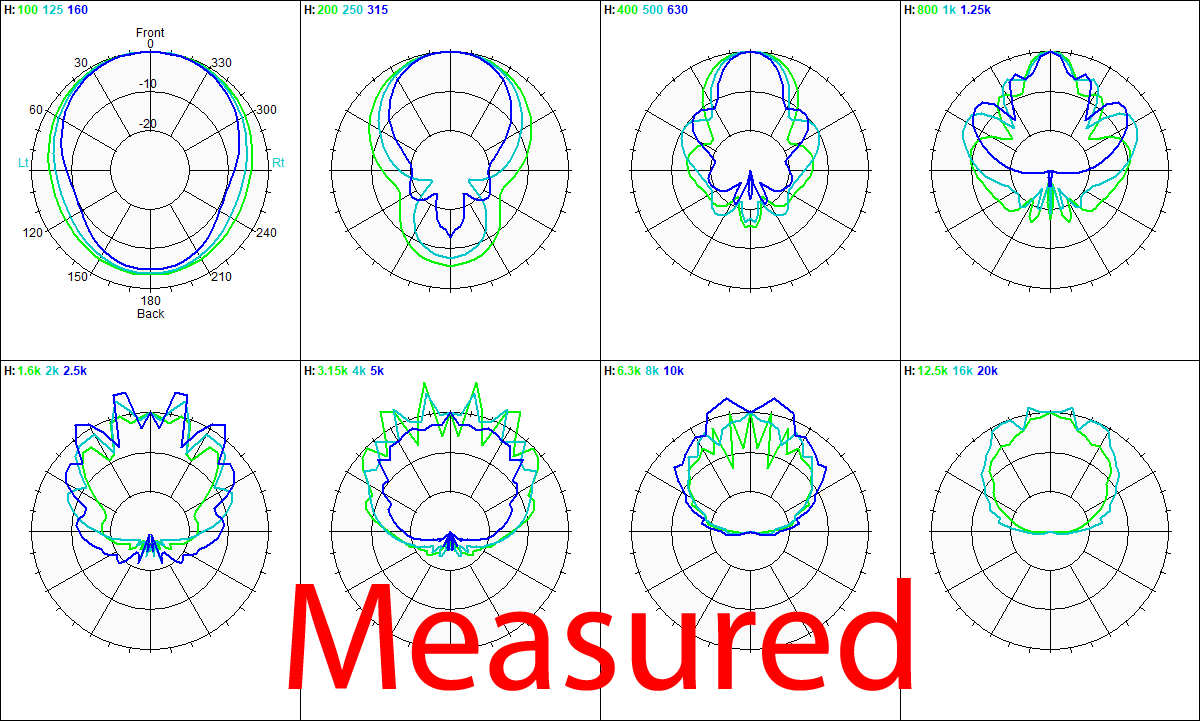
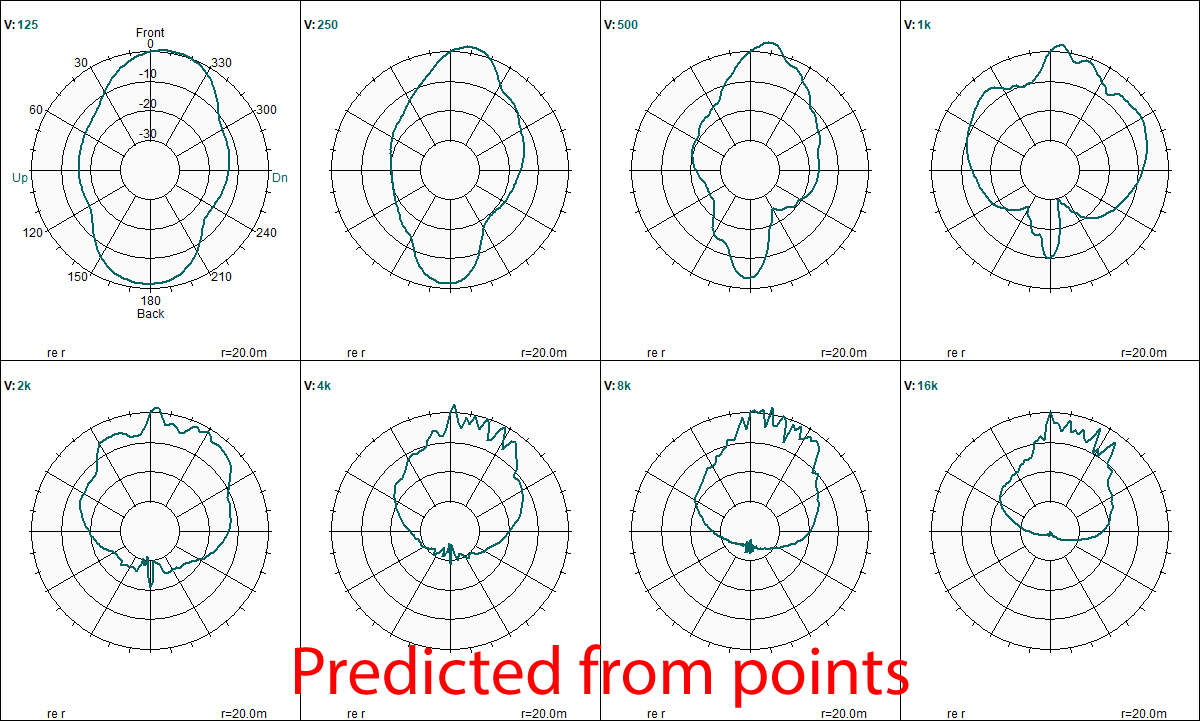
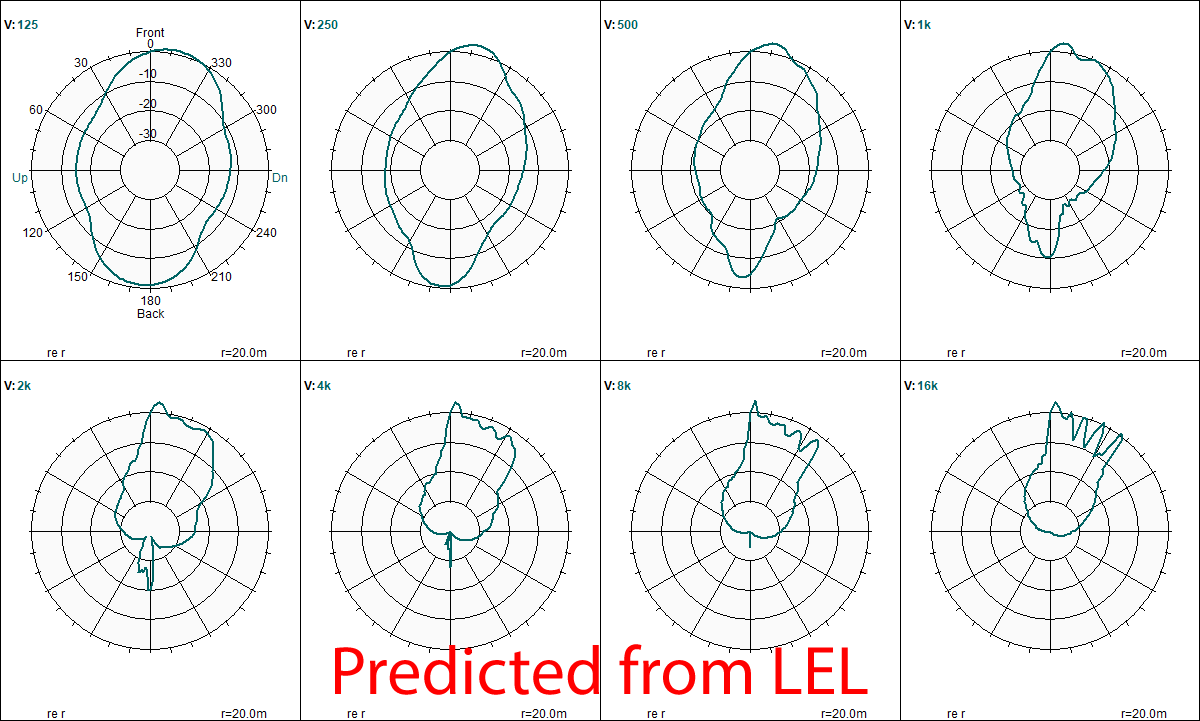
Below is a comparison of measured vs. modeled horizontal polars for a 3-box horizontal array of typical “12-in. + horn” boxes, performed in CATT-A. The angular resolution is 5 degrees for the measured and 2.5 degrees for the modeled. The correlation between the measured and modeled responses, while not exact is actually quite good in the mid band when one considers what the modeled response cannot account for. It is more than adequate for determining whether to deploy the array, which is the objective of the investigation. The finger lobing in the higher octaves could be better resolved with 2.5 degree (or finer) angular resolution, but each halving of the angle requires 4x the number of measurements – over 10,000 for 2.5 degree data. One must ask if higher resolution to resolve interference is worth the effort.
It is important to have the correct expectation level when modeling arrays. This array does not provide even horizontal coverage, which is probably what the system designer needs to know.

